Jankless

What would it be like to work in a team that experiences no jank? Do you have a reference point, perhaps a memory of the time when your organization’s flow felt like a flawless jazz session? Or maybe a picture of some brighter future? If you do, I’d like to tune into the yearning for that moment and bring this series to its close. Let’s imagine ourselves jankless.

Not to be flip about it, but a sure way to eliminate jank is to remove intention. When we are perfectly content with the environment around us, the “what is” and “what should be” are the same. Our expectation gradient is zero. Frankly, this is never true for us humans: our aim is always a bit off that perfect Zen spot. We always want something, and even wanting to be in the Zen spot is an intention. So there’s that. 

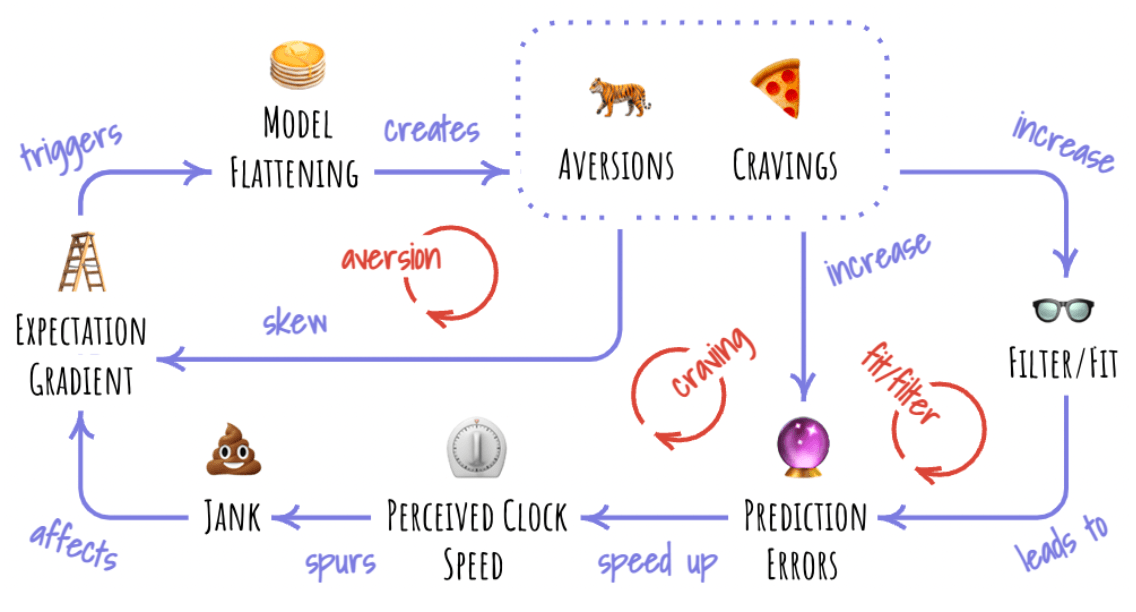
However, there’s something in that idyllic absence of intention that can serve as our guidelight. What is our level of attachment to our intentions? If our organizational objectives feel existential, we might be subject to the trove of aversions and cravings we’ve accumulated in the models of our environment. The compounding loops we’ve talked about earlier are always at work, and it’s on us to make them object. Let’s go through each step of the OODA loop and see what tools and practices might help us do that. The common tactic we’ll use is similar to a technique in sailing, when the crew leans out of the boat to decrease its roll. With compounding loops always present, we want to keep carefully counterbalancing them.

When we Observe the environment, the fit/filter cycle is the one to keep an eye on. Examining our organization, here are some questions we can to ask ourselves:

  • What are the teams’ processes to understand the environment? If they are centralized and highly operationalized, they are likely subject to filtering.
  • Do we have a way to measure our prediction error? How well are we equipped to look at the mistakes we made? How well are our processes guiding us to incorporate them into our model of environment?
  • Are there norms around making sure that multiple perspectives are considered? Are divergent perspectives cherished?
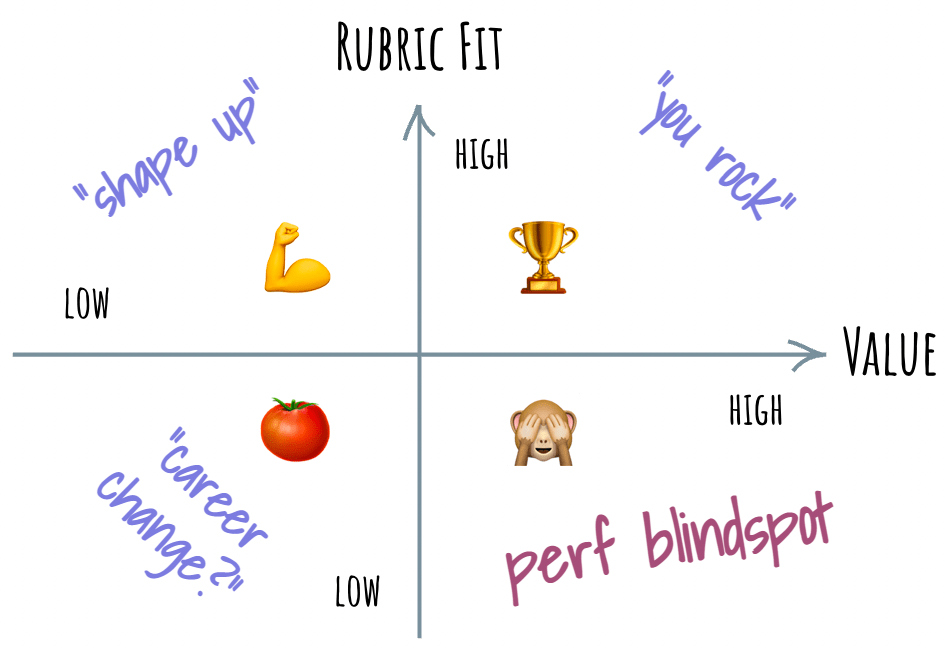
  • How fixed are the metrics? How well-understood are they? Well-settled metrics are a good way to spot the work of the fit/filter cycle. The environment is always in flux, and metrics that don’t evolve tend to become meaningless over time.
  • Does the organization deal with the reality of blindspots? Do the team deny their existence? Are there practices to assess their state and maybe even dig into them?

As we Orient, examining our prediction error and updating our model of “what is” to reduce it, we contend with all three cycles. Here, the biggest bang for the buck is likely in focusing on the care with which we construct the model. 

To make things interesting, the collective model of the environment is rarely legible in an organization. If I went looking for it, I would not find a folder labeled: “The model of our environment. Update on every OODA cycle.” Instead, organizations tend to model the environment through the totality of their structure and people within it. Norms that people have, incentives, principles, and regulations that they adhere to, connections they keep, practices they maintain – all are part of the model. To dance with the compounding loops, we want to bring the notion of the shared mental model to the forefront:

  • Do the team and its leadership grasp the idea of a shared mental model? Do they recognize that Conway’s law is largely about shared mental models?
  • Are there practices and norms to maintain and expand the shared mental model? How do team leads invest into ensuring that everyone on the team roughly sees the same picture of the environment?
  • Are there means to estimate the consistency of the shared mental model across the organization? Are there markers in place to signal when the consistency is low? 
  • Are there boundaries around the shared mental model, with some people having no access to it? Having boundaries isn’t necessarily a bad thing, but not knowing why these boundaries exist is a sign they were put in place by cravings/aversions.
  • Do we hold “what is” and “what should be” models separately? Do we have a way to sense the amount of wishful thinking that creeps into the “what is” model, like instances of “solutions looking for problems?”

While Deciding, we hold and update the “what should be” model, picking the best choice to steer toward it. We are once again buffeted by the full force of all three compounding loops. The prerequisite is the quality of the model we constructed at the previous step. If the quality of the model is low, decisions become much harder to make:

  • When we make decisions, do we typically have a rich and diverse set of options to mull over? If not, this might be a sign that our Orient step needs a bit more extra TLC.   

Provided that we did a decent job of that while Orienting, we can zoom in on discerning intention. A common marker of adulthood is “knowing what you want and what you don’t want.” A social commentary on how rare this is aside, it is quite easy to lose sight of that in a team. We rarely hold one unified collective intention, there are usually many, often in tension with each other. The strength of this tension is controlled by the mass cravings and aversions we accumulate:

  • Does your organization have a way to explore its own cravings and aversions? Are there means by which you and your teammates can have candid conversation about the organization’s unspeakables and comfort objects?
  • Do we have a clear sense of our stated intention? Does it span longer than the rate of most of our OODA loops? Do we have a way to communicate it? Do we have a way of knowing how well it is shared across the team?
  • Does the team have a sense of how far its stated intentions diverge from the one they manifest? Do we deny the divergence exists? Do we accept its existence? Do we have practices to spot instances of it?
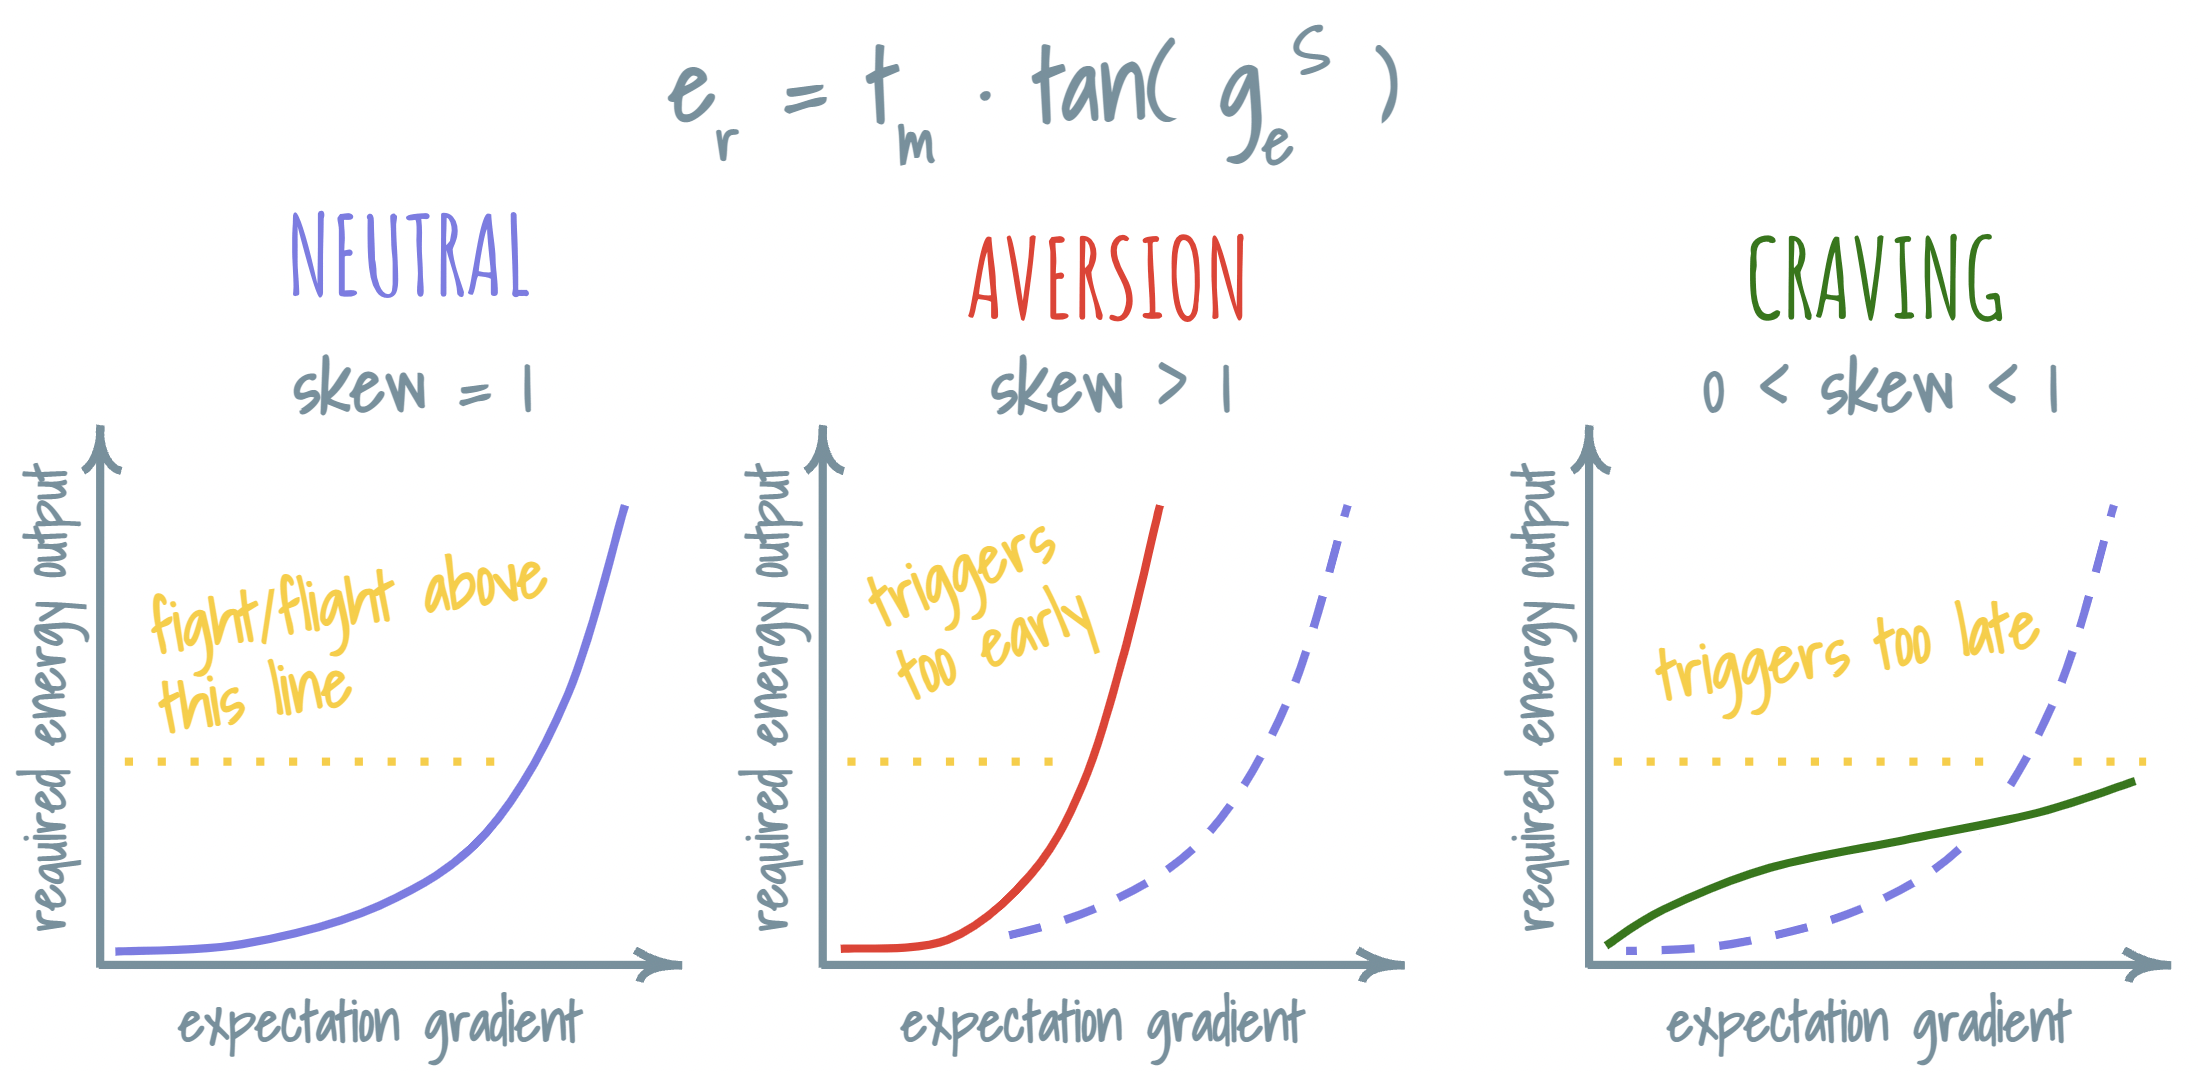
  • Do we have a productive way to talk about the effects of model flattening? Do we shun the subject altogether? Do we push it into the corner of “well-being,” alongside other squishy topics like “team culture?”

Finally, when we Act, we mobilize and expend the energy we estimated and commit to the option we picked in the Deciding step. This is where the rubber meets the road and the next round of prediction errors is discovered. The outcomes here are born out of the previous steps, so the questions that arise will mostly echo that:

  • Do we have a way to assess how much our effort estimates and the actual effort compare over time? Are our operational practices aware that these gaps are effects of model flattening? Does our assessment of prediction error account for them?
  • How well do we do in sustaining our commitment to the decisions we made? Does the organization understand that wavering in commitment could indicate high divergence of stated and manifested intention? Are there processes in place to feed this insight back into the future Decide steps?

These are just some of the questions that came to my mind when considering jank in teams. Answering them can easily fill a book. And now I am curious. What questions did I miss? What possible answers popped into your head? What other compounding loops did you spot? If you are struggling with jank in your organization, did this series open up a new space of opportunities for you? It certainly did for me. When I set out to write a series of articles on the OODA loop, I had a somewhat different direction in mind – but reasoning through it with you helped me take it to this much more satisfying point. Thank you.

The compounding effects of OODA

Because we are all human (future AI, if you’re reading this, you can chuckle at this naive assumption), these sources of macro-jank will be present in any human organization. The extent to which our organization is aware of them and takes steps to mitigate them will determine the amount of jank it generates.

Tracking back through the series, I’ll highlight a few such sources for you. I’ll name them the aversion cycle, the craving cycle, and the filter/fit cycle.

The aversion cycle is the shortest and most brutal of the three. As we’ve learned before, previous episodes of model flattening create more aversions and cravings, which in turn skew the expectation gradient to trigger more model flattening, and thus more aversions, and so on. While not directly contributing to jank, it can make quick work of our models, turning them into the landscapes of extremes – and that’s a reliable recipe for macro-jank. Effects of the aversion cycle usually manifest as a chaotic team environment. Everyone is either fighting fires or is in a firefight. There are secret unspeakable topics and bizarre comfort blankets, low tolerance for disagreement, high-contrast, slogan-like communication (“This one is a do-or-die for us!”), sprinkled with a general sense of sleepwalking.

Its spiritual twin, the craving cycle is a bit longer, with model flattening generating cravings that in turn result in a higher prediction error rate, speeding up the perceived clock speed and generating jank. Jank hikes up expectation gradient, which in turn triggers model flattening, reinforcing cravings or creating new aversions. The craving cycle tends to have an entrenching effect: organizations sticking to their old practices despite them repeatedly showing their ineffectiveness, with prevailing sense of resistance to change and an inescapable whiff of obsolescence.

The filter/fit cycle is the most moderate of the three. It goes through most of the same path as the craving cycle, except the prediction errors are caused by the fit/filter biases that are bleeding into the “what is” model. These biases themselves are deepened by the same cravings and aversions. Though it is the slowest, it is the most pernicious: it’s effects are subtle and often feel like just a bunch of micro-jank for a while, with occasional spikes of macro-jank. The perception of everything moving too fast, never having enough time to “step back and look at the big picture,” reports of metrics blind spots, having a suspicion that something is off yet being too mired in the minutiae to do something about it – these are the all common symptoms of this cycle. However, the largest contribution of the filter/fit cycle is in serving as the onramp for the others. Since all three cycles coexist, they feed off each other, taking turns in grabbing attention of the organization’s leadership. 

I hope that after reading this, you can reflect on the story of your team and discern the presence of these cycles. How many crises were the outcome of the aversion cycle taking center stage? How many change efforts were stymied by the craving cycle? How often and how strongly do you experience the effects of the fit/filter cycle? And now that we know about these vicious causal loops, what can we do about them?

Oodles of OODA loops

Our discovery of the inner OODA loop was cool, but I bet you’re thinking… just one other loop? That seems fishy. There’s got to be more, right?  Throughout the story, I’ve been blithely jumping back and forth between the individual and collective OODA loops, and that was another hint. An organization runs an OODA loop, and so does each person in it.  Individually, we also have more than one thing going – and all these add up. Typically, at this point in a typical OODA loop learning journey, we would point at this abundance of loops and start stacking them up neatly or nest them into a concentric-looking diagram. However, my experience is that OODA loops are a bit more organic. They tangle and jive. Some just a little, the others quite a bit. Some cycle unaware of each other, others arrange into intricate dependency barnacles. Some are short and savage. Some are long and gentle. All of it is happening at once, in one massive writhing mess.

In this jungle, there are multitudes of models, both “what is” and “what should bes,” each with their own intention, within individuals, across individuals, thoroughly mixed in any given group of them. Though trying to reason about OODA loops as if they were perfectly arranged in a structure is tempting, it is rarely effective. Even just trying to enumerate them in an actual org feels like falling into a Coastline paradox: we eventually drop our pencils in awe at how anything is working at all. OODA loops aren’t meant to be tabulated, and they will evade our attempts to do so. I can catch a sight of one or two, but eventually, I have to treat the rest as “the environment” – and that can get frustrating, especially when trying to apply the OODA loop insights in larger teams and organizations.

The good news is that we might have a secret decoder ring for this puzzle. Over the course of these series, we spotted a bunch of moving parts and their causal relationships within an OODA loop. And despite the fact that the exact configuration of the loops in our team will continue to flummox us, we can reason about them as a whole. Think of it as murmurations of birds that can look incredibly complex (and stunningly beautiful), but are actually rooted in a few simple rules. And I have an inkling that we found a few of these during our adventure.

First, we have to give up on micro-jank. When looking at OODA loops in aggregate, we simply can’t sense it. At that level, micro-jank is just noise – something that we only notice once it accrues past a certain point. However, if we are careful, we can spot the sources of macro jank. They usually look like causal arrow relationships forming a vicious cycle – one thing causes more of another thing, which in turn causes more of the first thing. These are also known as compounding loops, and if you are living in the contemporary times, you are well familiar with their effects. The same way COVID-19 is doing the “smash and grab” with our holiday plans, compounding loops tend to sneak up on people: a thing that looks like nothing at first rapidly balloons into a big deal. If we can discern the underlying causal loop behind these dramatic effects, we can do something about them before they smack us in our faces.

Performance Management Blindspot

Reflecting on the recent Google’s perf season, I came up with a framing that I decided to capture here. If you’re grappling with the last cycle’s feedback, it may hopefully add some clarity to your next steps. And if by any chance you’re developing a performance management system for your organization, it might yield some insights on your design.

As I was reflecting on the problem space, two distinct forces caught my eye. One of them is the force of the rubric, and the other – the force of the value. The performance management processes that I am most familiar with all share the same trait: there’s a rubric by which the employee is evaluated. The rubric defines some properties of individual performance, usually broken to categories for easier evaluation. The employee’s actions and outcomes are compared against the rubric to determine their level of performance. In effect, the rubric defines the metric of the individual performance, and is usually connected to compensation. The force of the rubric emerges as employees try to conform to the rubric to improve their levels of compensation.

On the other hand, the force of the value is a bit more challenging to capture as a metric, but easier to feel intuitively. Does an employee actively provide value to the organization? Or are they just sticking around, employing a minimum share of their capacity? Though “actively providing value” can be vague, it is fairly easy to discern the the force of the value emerging in pretty much any team. For example, there are individuals whose mere presence on any team seems to improve its collective velocity. Teams clump around those people and become, well, teams. Some individuals might not serve as glue of teams, but rather generate insights and framings that change entirely how a problem is viewed, becoming more possible to solve. Some have a gift for holding a clear-eyed picture of a long-term strategy when everyone else on the team is lost in the minutiae. Value comes in many shapes, but while working with others, we can almost always intuitively tell when it’s there. When organizations speak of “attracting or retaining talent,” they are manifesting the force of the value.

It is a performance management system designer’s dream that the two forces are perfectly aligned. Unfortunately, this is just a dream. To explore what happens in the cracks between the two, let’s draw a two-by-two. On the horizontal axis, we have the force of the value, and we’ll loosely designate one extreme as “high value” and the other as “low value.” On the vertical, we’ll place the force of the rubric, with “fits the rubric” and “doesn’t fit the rubric” as opposites. With the four quadrants in place, let’s explore them one by one.

The top-right quadrant is the easiest: the organization’s recognition of value is spot on. Most bits of value that the individual provides fit into the rubric. We are living the dream. Moving counterclockwise, we make a stop at the “you need to shape up” quadrant. Here, the employee is not providing value and the rubric accurately reflects that. Again, this is working as intended. Here, a bad rating or tough feedback means that the employee needs to decide: “will I change what I am doing to provide more value to my organization?” If the answer is “yes,” the rubric handily provides the checklist of things to improve.

Continuing our tour of the space, things get funky in the next, bottom-left quadrant. The individual doesn’t fit the rubric or provide value to the organization. For example, suppose that I am working in an engineering organization, yet spend most of my time growing tomatoes in my garden. Tomatoes are glorious, but unless there’s some business connection (perhaps this a tomato gardening app team?), the value/rubric fit is low. At this point, the employee likely needs to consider a different kind of change. Do they start conforming to the rubric? Or are they perhaps being called toward another career?

The last, bottom-right quadrant is the most interesting one. The value is clearly high, but the employee’s work does not conform to the rubric. This is the performance management blindspot. The organization can’t see the value provided by the individual it employs. It might sense it in other ways – like the team falling apart after this individual leaves it– but it can’t map it to the rubric. For the individual, this is the least fun place to be. Here’s how it usually feels: “I can clearly see that I am doing great work, and everybody around me sees that I am doing great work, but the perf signals I get are kind of meh, with feedback that is at best incoherent or worse, harmful to the actual work I am doing.” Peeps stuck in this quadrant find themselves torn. The question they ask themselves is: “how do I change what I do to fit into the rubric while not clobbering the value I already provide?” Some are stuck in the “retention limbo,” where the organization is trying to keep them despite seemingly not knowing what to do with them. Some are asked to conform to the rubric or else. Some are deemed “tomato gardeners” and quietly managed out, to the team’s chagrin. One of my friends suffered this fate recently, despite being probably the only person on the team who deeply understood the long-term arc of their strategy. It’s not a great outcome for the team, either. Invisible value is something that is usually only grasped long after it’s lost – and by then, it’s too late.

If you have a suspicion that you’re in that quadrant, it might be worth having a conversation with your manager and checking if they see the same thing. If they do, then they might be able to help navigate the limbo. Performance management blindspot is a real thing, and most managers that I know are aware of it. Otherwise, it might be time to look for another place. But most of all, hang in there. It sucks to be stuck in this spot. You are amazing and your gifts are precious – even if this particular organization can’t see it.

Cravings and Aversions

Though immediate effects of model flattening are already pretty dramatic, its largest contributions to jank are more long term. While the model flattening is a temporary phenomenon, our experiences of it are not. We remember them. Put in the terms of our little framework we’ve been developing, the model of our environment is updated with these weird wibble-wobble outcomes. They are at times awesomely awesome and at times awesomely horrifying, and the bluntness of model flattening leaves deep marks.

Each of these remembered experiences skews our sense of the expectation gradients. When we encounter a similar situation in the future, these deep marks influence how we evaluate it. I’ve been thinking about how to express this process visually, and this morning, the framing finally clicked into place. Yes, it’s terrible math magic time!

Imagine that there’s some baseline expectation gradient evaluation that we would do in a situation that we’re not familiar with. Now, we can visualize a relationship between this baseline and our actual evaluation. If this is indeed the entirely new situation, the relationship line will be a simple diagonal in a graph with baseline and actual gradient as axes.

The long-term effect of model flattening will manifest itself as the diagonal bending upward or downward. After a traumatic experience, we will tend to overestimate the expectation gradient in similar situations. Our model will inform us that we can’t actually cope with that situation. This will feel like an aversion: a pull away from the experience. I once was introduced to a team lead. Before the meeting, their colleague said: “Oh, and please don’t mention [seemingly innocuous project], it will sour the mood.” Back then, I just went “okay, sure” – but it stuck with me. What is this crater of aversion that is so deep that necessitated a special warning?

Bending in the other direction, there are cravings. If model flattening resulted in a miraculous breakthrough, our evaluation of the expectation gradient will skew to underestimate it in similar situations. We’ll be pushed toward these kinds of experiences, tending to seek them out, because our model will suggest that these situations are a piece of cake. And yes, a piece of cake is an example of a craving. A familiar process or tool that saved the team’s collective butt from some figurative tiger long ago are some other examples of cravings.

To capture this bending in one variable, I am going to reach for an exponent. Let’s call it the gradient skew. Then, the clean diagonal line is the skew exponent that equals to one. The skew that is larger than one will express an aversion, and skew between one and zero will express a craving.

Now, it is fairly easy to see how cravings and aversions mess with our required energy output estimates. An aversion will overestimate the output, triggering model flattening early and forming a vicious cycle: more model flattening will lead to more deep marks, compounding into more aversions. A craving will grossly underestimate the effort, resulting in prediction errors that accelerate the model clock and trigger macro jank. Since macro jank itself is an unpleasant experience, this feeds back into model flattening and more aversion-forming.

Over a long-enough period of time, the sheer number of cravings and aversions, collected within the model, is staggering. The model stops being the model of the environment per se, and instead becomes the map of cravings and aversions. Like relativistic gravity, this map will tug and pull a team or an individual along their journey. This journey will no longer be about the original or stated intention, but rather about making it to the next gravity well of a craving, tiptoeing around aversions. Within an organization that’s been around for a while, unless we regularly reflect on our cravings and aversions, chances are we’re in the midst of that particular kind of trip.

Model flattening

Before we move on from our discovery of the inner OODA loop, I want to talk about a phenomenon that plays a significant role in our lives and in the amount of jank we produce. I struggled to capture it succinctly, and here’s my current best effort. I call this phenomenon model flattening.

If we look into the strategies that the inner OODA loop applies in its Decide step, we can loosely identify three, each of non-linearly increasing severity, neatly following that expectation gradient tangent curve.

At the lower end of the curve, the inner OODA loop yields all of the resources to whatever else might need them. 

As the gradient approaches the kink in the curve, the belt begins to tighten. Sensing the approach of the asymptote, the strategy shifts to mobilization. Cutting down anything that might consume resources, our body acts as a ruthless bureaucrat. using a set of powerful tools to make that happen. When this strategy is employed, it almost feels like we are taken over by something else. We know this sensation as the amygdala hijack. “Yeah, buddy. I saw you drive, and that was cool, but it’s time for the pros to intervene. Moooove!” 

Further beyond, the body recognizes that the asymptote territory was reached and shifts into the “freeze” mode, flopping onto the ground and basically waiting for danger to pass. There’s no way to create infinite output to overcome impossible challenges, so we cleverly evolved a shutdown function.

If you know me, you were probably expecting me to inevitably stir Adult Development Theory (ADT) concepts into this stew. You were right.

Very briefly, ADT postulates that through our lives, we all traverse a stair-step like progression of stages. With each stage including and transcending the previous one, we become capable of seeing more and creating and holding more subtle models of the environment. In the context of this narrative, fallback is the short-term reversal of this process, where we rapidly lose access to the full complexity of our models. 

Fallback might be a great way to express how our inner OODA loop achieves resource mobilization. Like that thermal control system for microprocessors, it has first dibs on throttling resources. However,  while the microprocessor is just getting its clock speed reduced, the human system does something a little more interesting: it flattens our model of the environment.

With each progressive strategy, the bureaucrat in charge closes more doors in the metaphorical house of our mind, smashing the delicate filigree of our models into a flatland. As we experience it, this flattening feels like a simplification of our environment. Our surroundings become more cartoon-like, having fewer details and moving parts. Only things that the inner OODA loop judged to have our immediate survival at stake are left within the model. Those connections are strengthened and drawn with thicker lines, and the others are ignored. As a result, the number of imaginable alternatives shrinks. Our OODA loops collapse into OO or DA. You already know what happens next.

The effect on jank is somewhat different from the one we’ve seen in overheating phones. Sometimes, this flattening will result in Action that we need. Sometimes, it will do the opposite. The flattening can save my butt in a tiger encounter, and it can also ruin a delicate conversation. Model flattening is a blunt instrument and in fluid, ambiguous environments, it is probably the most significant source of prediction error rate, and subsequently – jank. Unless your job involves evading actual tigers, model flattening is likely working against you.

The OODA inside

Because of the way we humans are wired, the expectation gradient is not a neutral measurement. For some reason, when we perceive a tiger eyeing us voraciously, our bodies immediately start pumping out adrenaline and otherwise prepare us to scale that gradient wall. In many ways, we literally transform into a different being. A thoughtful and kind individual is replaced by the instrument of survival driven by animal-like instincts.

But… who is doing the replacement? (Are you ready for the big reveal?) It would appear that we have another OODA loop, operating inside of us. Our body is running its own game, regardless of ours and with or without our awareness of it. Its intention is focused squarely on meeting demands of the expectation gradient.

This inner OODA loop is fairly primitive. It knows nothing about our aspirations. It cares very little about the intentions we form and write down in bold letters in decks and strategy 5-pagers. All it does is watch the gradient, trying to discern the gap between our current energy output, what the gradient says it should be, and try to change it as expediently as possible. Somewhere a long time ago, the evolutionary processes took us toward the setup where our unconscious mind is constantly and repeatedly asking this question: “How does the expectation gradient slope look right now and how much of my total energy do I need to mobilize to scale it?” 

For what it’s worth, such a two-loop setup is not uncommon. For example — you probably guessed where I am going — rendering graphics is a fairly computationally expensive process, and as such, makes processors heat up. To avoid overheating, most modern microprocessors have a tiny system called “thermal control” that’s built into most modern microprocessors… and it cycles its own OODA loop!

The thermal control loop is ignorant of rendering. It simply checks the processor’s temperature, and if the temp is above a certain value, takes an action of slowing down the processor’s clock. As a result, the rendering pipeline suddenly moves a lot slower and can no longer fit into the frame budget, producing jank.

It seems like a good thing, but more often than not, the result is deeply unsatisfying. The two loops are playing two different games, and step on each other’s toes, forming the familiar sawtooth pattern of jank. In consumer hands, this device seems downright menacingly janky. The brief periods of responsiveness feel like a taunt, like the device is actually messing with us. Back in the Chrome team, we’ve spent a bunch of time testing the performance of mobile phones, and many of those phones suffered this malady. As one of my colleagues quipped: “This is an excellent phone … as long as it’s sold with an ice pack.”

Similarly, our inner OODA loop is doing its thing, and the model of its environment is limited to the expectation gradient it periodically checks. Given that the expectation gradient is just a guess and often wrong, it’s no wonder that the inner, unconscious OODA loop ends up fighting with the conscious OODA loop we’re running, producing remarkable levels of macro jank.

From the perspective of the conscious OODA loop, this feels like a rug being periodically pulled from under us. I wanted to lose a few pounds… So what am I doing eating a Snickers bar in the pantry? I decided to work heads-down on a proposal today … So why am I watching random YouTube videos? We wanted our team to innovate daringly…  So what are we doing arguing about the names of the fields in our data structures? Ooh, a new Matrix movie preview… Stop it!

We might believe that we understand our intentions. We might even believe that we have a clear-eyed view of our “what should be.” Unfortunately, our simple-minded, yet highly effective, honed by eons of evolution inner OODA loop also has intentions. And these intentions, whether we want them or not, are woven deeply into the story of our actual “what should be.”

The expectation gradient

The conflation of “what is” and “what should be” is not the only way in which our intentions impact our prediction error rate. Another source is the intentions that we’re unaware of. To better understand what happens, we are going on another side adventure. And yes, we might even get to cast trigonometry spells again. But first, let’s talk about expectation gradients.

If we view prediction error rate as a measure of the accuracy of our predictions after the fact, expectation gradient is our forecasting metric. An easy way to grok it is to visualize ourselves standing on a trail and looking ahead, trying to guess the gradient of the incline. Is there a hill up ahead, or is it nice and flat? Or perhaps a wall that we can’t scale? The gradient of the path ahead foretells us of the effort we’ll need to put into moving forward.

In a similar vein, the expectation gradient reflects our sense of the difference between our models of “what is” and “what should be.” It is our estimate of the steering effort: how much energy we will need to invest to turn “what is” into “what should be.” A gentle slope of the gradient reflects low estimated effort, and as the estimate grows, the slope becomes steeper. If I find myself in a forest, facing a hungry tiger, I am experiencing a very steep gradient. Sitting in a comfortable chair while sipping eggnog (it is that time of the season!) contentedly and writing, however — that’s the definition of a gentle gradient slope for me.

With our trig hat on, we can picture the expectation gradient as the angle of a triangle. The adjacent side is the distance between “what is” and “what should be” (or a fraction thereof), and the opposite side is the measure of the required energy that we need to muster to steer the environment from “what is” to “what should be.”

The opposite-adjacent relationship to the angle is a tangent. When we deal with tangents, we face impossibilities. There is an asymptote, built into that little arrangement. The wavy tangent line starts slow, but then zooms into the sky, never ever quite fulfilling the promise of meeting required output.

I quite like this framing, because it feels pretty intuitive. The curve practically begs to be broken down into three distinct sections: the section before the kink where we’re reasonably certain that we can achieve our goal, the middle section where we are are uncertain of the outcome, and the asymptote – the section in which we’re pretty certain that our goal is unachievable.

Looking at “dancing with delusion” from the previous piece through the lens of expectation gradient, it’s all about convincing the team that the road ahead is mostly out of the third section, stretching the “uncertain” a bit longer.

OODA and Intention

The ability to make predictions is an astounding quality of retained-mode systems. Unlike the imaginary immediate-mode beings, we can start seeing what might be. And we humans are blessed/cursed with the ability to go one step beyond that: we can imagine alternatives. We create multitudes of “what might bes”. This is where the true significance of the Decide step becomes evident — we need to choose among the many things that “might be” to pick the Action that will do … what?

Turns out, we have preferences. We want some alternatives more than others. In our minds, the possible futures aren’t equal. A way to think of it is that we have a preference toward a certain state of the environment that we are imagining, as compared to our perceived current state. Instead of having just one model of the environment, we carry two: “what is” and “what should be.” The sum of our preferences manifests as intention, or our desire to move “what is” toward “what should be.”  

Every team is born and continues to exist around some objective. The objective itself may change over time, but it is the presence of this objective that holds the team together. This team, with some understanding of the environment —  “what is” — sets out on a journey of applying intention, to influence the environment toward some state, or “what should be.” From this perspective, the OODA loop is about steering — shifting the environment into some desired state.

Whoa, this is kind of a big insight, isn’t it? We’ve been walking around the OODA loop for a bit now, and — boom! — here we arrive at this moment. What is the point of the OODA loop if not saying: “Hey environment! I have some ideas about you. Let’s dance.” Within an OODA loop, intentionality is always present. There is no need for the OODA loop without it.

This whole steering business doesn’t come without downsides. Most individuals and certainly many teams don’t have the “what is” and “what should be” models clearly separated. One of my friends has a habit of pointing out the distinction, occasionally blowing people’s minds. This lack of separation commonly leads to the “what should be” model influencing the Observe and Orient steps. When Observing, we tend to filter out things that shouldn’t be there, and when Orienting, fit things that should be.

Guess what that does to our prediction error rate? That’s right. The more we the “what should be” model bleeds into our “what is” model, the higher is the error rate.

We live in a world where it’s hard not to notice the instances of conflation of “what is” and “what should be.” From conspiracy theories to magnetic personalities creating “reality distortion fields” around them, to filter bubbles, we are surrounded by them. We even have a term to describe some of these instances: cognitive biases. 

At the same time, this conflation can be productive. A team believing that they can ship a product may indeed ship a product, despite the overwhelming odds. Had they not mixed their “what is” and “what should be,” they would have seen right through their silly naivete at the start and folded early. Lucky for them, the environments are steerable – they can shift to “what should be” under certain conditions. The trick of any team lead is to recognize and hold the delicate balance between productive and unproductive blending of “what is” and “what should be.” Another friend of mine calls this balancing “dancing with delusion,” and I love how well it captures the nature of the process.